Applied computer vision / Master’s thesis / 2026
TomatoVision
One scene.
Different hypotheses.
A computer-vision study that detects three greenhouse tomato maturity stages and compares a YOLOv11 baseline with modified models and a three-model WBF ensemble.
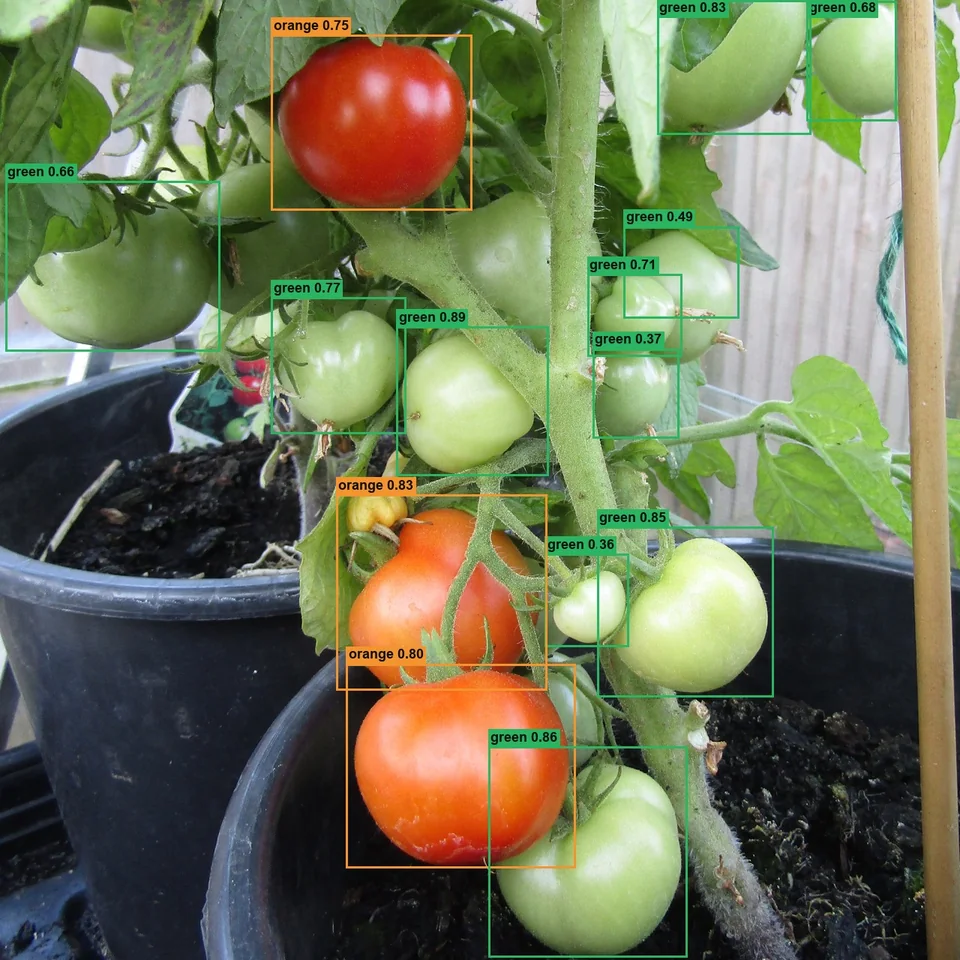 Inspect original ↗
The red fruit is classified as orange in this scene. Domain shift is shown as observed, not retouched. Photo: Kolforn; detections overlaid. Image adaptations shared under CC BY-SA 4.0.
,_Trimingham,_Norfolk_(1).JPG)
- My contribution
- Computer vision research · model development · evaluation
- Built with
- YOLOv11 · Swin Transformer · PyTorch · OpenCV · Weighted Boxes Fusion
Start with the work.
Greenhouse tomatoes overlap, hide behind leaves, and appear at different scales, making maturity detection difficult for a single detector configuration.
Adjie evaluated a YOLOv11 baseline, Swin Transformer and multi-scale SPPF variants, then fused their predictions with Weighted Boxes Fusion while reporting single-model and ensemble results separately.
Change the architecture.
Then test the ensemble.
- Baseline
YOLOv11
A fixed reference for the architectural comparisons.
- Single-model variants
Swin-T
+ multi-scale SPPFEvaluate the modified detector independently.
- Prediction fusion
Weighted
Boxes FusionCombine model outputs and report the ensemble separately.
The result depends
on what you run.
Single-model and ensemble results from the recorded thesis evaluation. These figures do not measure the demo photograph above.
| Configuration | Type | mAP@0.5 | mAP@0.5:0.95 | ms / image |
|---|---|---|---|---|
| YOLOv11 | single | 0.795 | 0.470 | 55.28 |
| + Swin-T | single | 0.805 | 0.474 | 53.46 |
| + Swin-T + MS-SPPF | single | 0.807 | 0.477 | 52.77 |
| Combine 1YOLOv11 + Swin-T | ensemble | 0.814 | 0.490 | 69.88 |
| Combine 2YOLOv11 + Swin-T+MS-SPPF | ensemble | 0.817 | 0.492 | 69.37 |
| Combine 3Swin-T + Swin-T+MS-SPPF | ensemble | 0.812 | 0.487 | 67.17 |
| Combine 4all three | ensemble | 0.824 | 0.499 | 88.93 |
Timing belongs to the recorded evaluation setup; it is not a browser benchmark or a deployment guarantee.
Keep the denominator
in the story.
- Source imagery
- 1,051 images · Known-You Seed Co., Pingtung, Taiwan
- Source annotations
- 12,168 green · 14,640 orange · 13,989 red
- Exported split
- exported 2,193 train (augmented) / 160 val / 160 test at 1280×1280
- Training configuration
- 1088px · batch 4 · 400 epochs · patience 100
The public record.
- YOLOv11 baseline
- 0.795 mAP@0.5
- Best modified model
- 0.807 mAP@0.5
- Three-model WBF
- 0.824 mAP@0.5
- WBF stricter metric
- 0.499 mAP@0.5:0.95